Childhood BMI and Childbirth: A Gap That Widens With Age
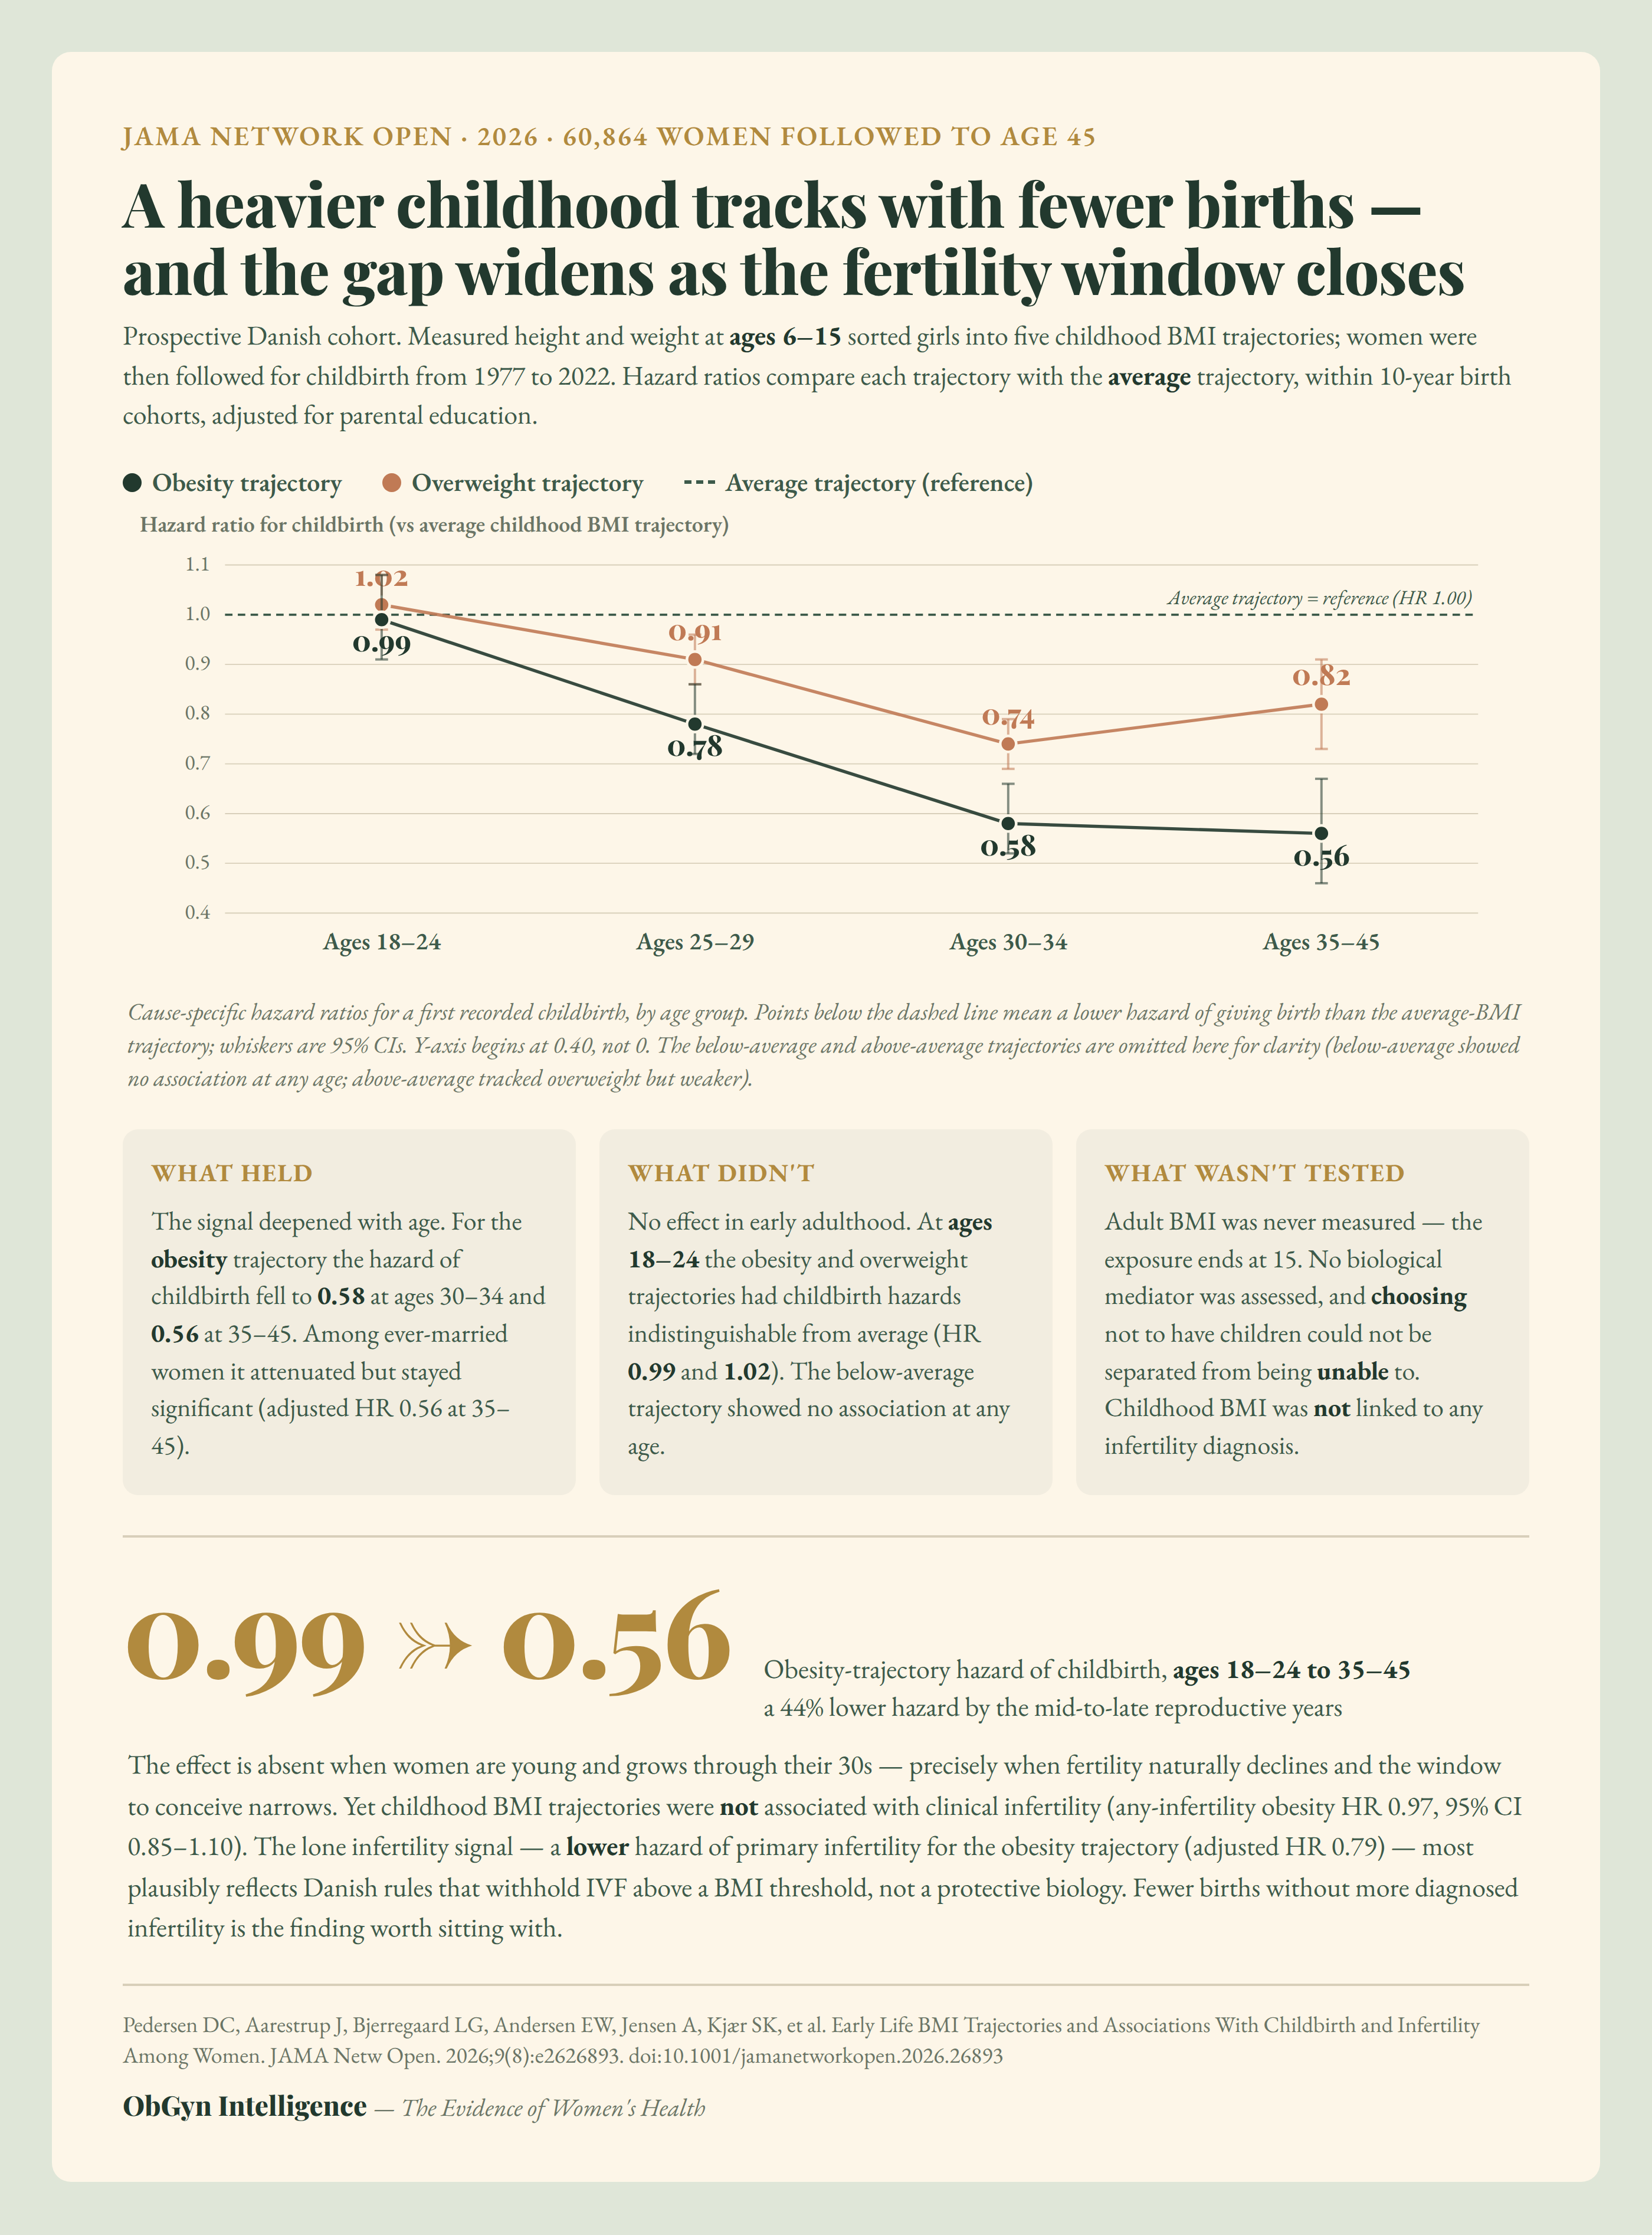
In 60,864 Danish women, a childhood obesity trajectory carried no fewer births at ages 18-24 but a 44% lower hazard of childbirth by 35-45 - with no matching rise in diagnosed infertility.
Click the figure to open it full size.
Summary
Pedersen and colleagues linked school health records to national registers for 60,864 Danish women born between 1950 and 1989, using measured height and weight from ages 6 to 15 to assign each girl to one of five latent-class childhood BMI trajectories - below average, average, above average, overweight, and obesity. Women were followed for a first childbirth from 1977 through 2022, and for hospital-based infertility diagnoses. Only 3.8% followed an obesity trajectory. Cause-specific hazard ratios compared each trajectory with the average trajectory, stratified by 10-year birth cohort and adjusted for parental education.
The association with childbirth was absent in early adulthood and deepened with age. For the obesity trajectory the adjusted hazard of giving birth was 0.99 (95% CI, 0.91-1.08) at ages 18-24, 0.78 (0.72-0.86) at 25-29, 0.58 (0.52-0.66) at 30-34, and 0.56 (0.46-0.67) at 35-45. The overweight trajectory followed a shallower version of the same curve (0.74 at 30-34). The below-average trajectory showed no association at any age. The pattern held, though attenuated, when analysis was restricted to ever-married women, arguing against partnership formation as the sole explanation.
The infertility results cut against a simple biological reading. Childhood BMI trajectories were not associated with any infertility (obesity adjusted HR 0.97; 95% CI, 0.85-1.10). The one signal - a lower hazard of primary infertility for the obesity trajectory (adjusted HR 0.79; 0.68-0.92) - is, as the authors caution, most plausibly an artifact of Danish policy that restricts publicly funded IVF above defined BMI thresholds, so heavier women may never be referred and never diagnosed. Fewer recorded births without a corresponding excess of diagnosed infertility is the tension the paper leaves open, and the exposure window closing at age 15 means adult BMI - the proximate variable during attempts to conceive - was never observed.
Clinical bottom line
- This is an association between a measured childhood exposure and a registry outcome, not a demonstrated causal or biological pathway; adult BMI, ovulatory function, and reproductive intent were not measured and act as unobserved mediators.
- The childbirth signal is age-dependent: null at 18-24 for every trajectory, then progressively lower for heavier trajectories, reaching an obesity-trajectory HR of 0.56 at ages 35-45.
- Childhood BMI trajectories were not associated with any infertility (obesity HR 0.97). Fewer births did not track with more diagnosed infertility.
- The lower primary-infertility hazard for the obesity trajectory (HR 0.79) should be read as an access-to-care artifact of BMI-based IVF restrictions, not protection - the authors say so explicitly.
- Strengths: measured (not self-reported) anthropometry, near-complete school-based ascertainment, and nationwide register follow-up. Limits: single-country cohort, lower-SEP underascertainment of infertility, and no data on BMI in adulthood.
Key references
- Pedersen DC, Aarestrup J, Bjerregaard LG, Andersen EW, Jensen A, Kjaer SK, et al. Early life BMI trajectories and associations with childbirth and infertility among women. JAMA Netw Open. 2026;9(8):e2626893.Primary source. All figures in this infographic are taken from this paper.doi:10.1001/jamanetworkopen.2026.26893 →
Related infographics

Placental Volume: 2D EPV vs 3D VOCAL™
A 30-second handheld measurement, checked against the gold standard in 58 paired scans.

Bot or Not: Readers Preferred the AI Story and Could Not Identify It
Three studies, 2,587 US adults, and a bias that points the opposite way from the blindness it accompanies.

Clinical AI Competence in Obstetrics and Gynecology
Adoption has outrun training: 81% of physicians report awareness or use of AI, while fewer than 15% report formal expertise in its clinical application.